 Case study · LobsterOne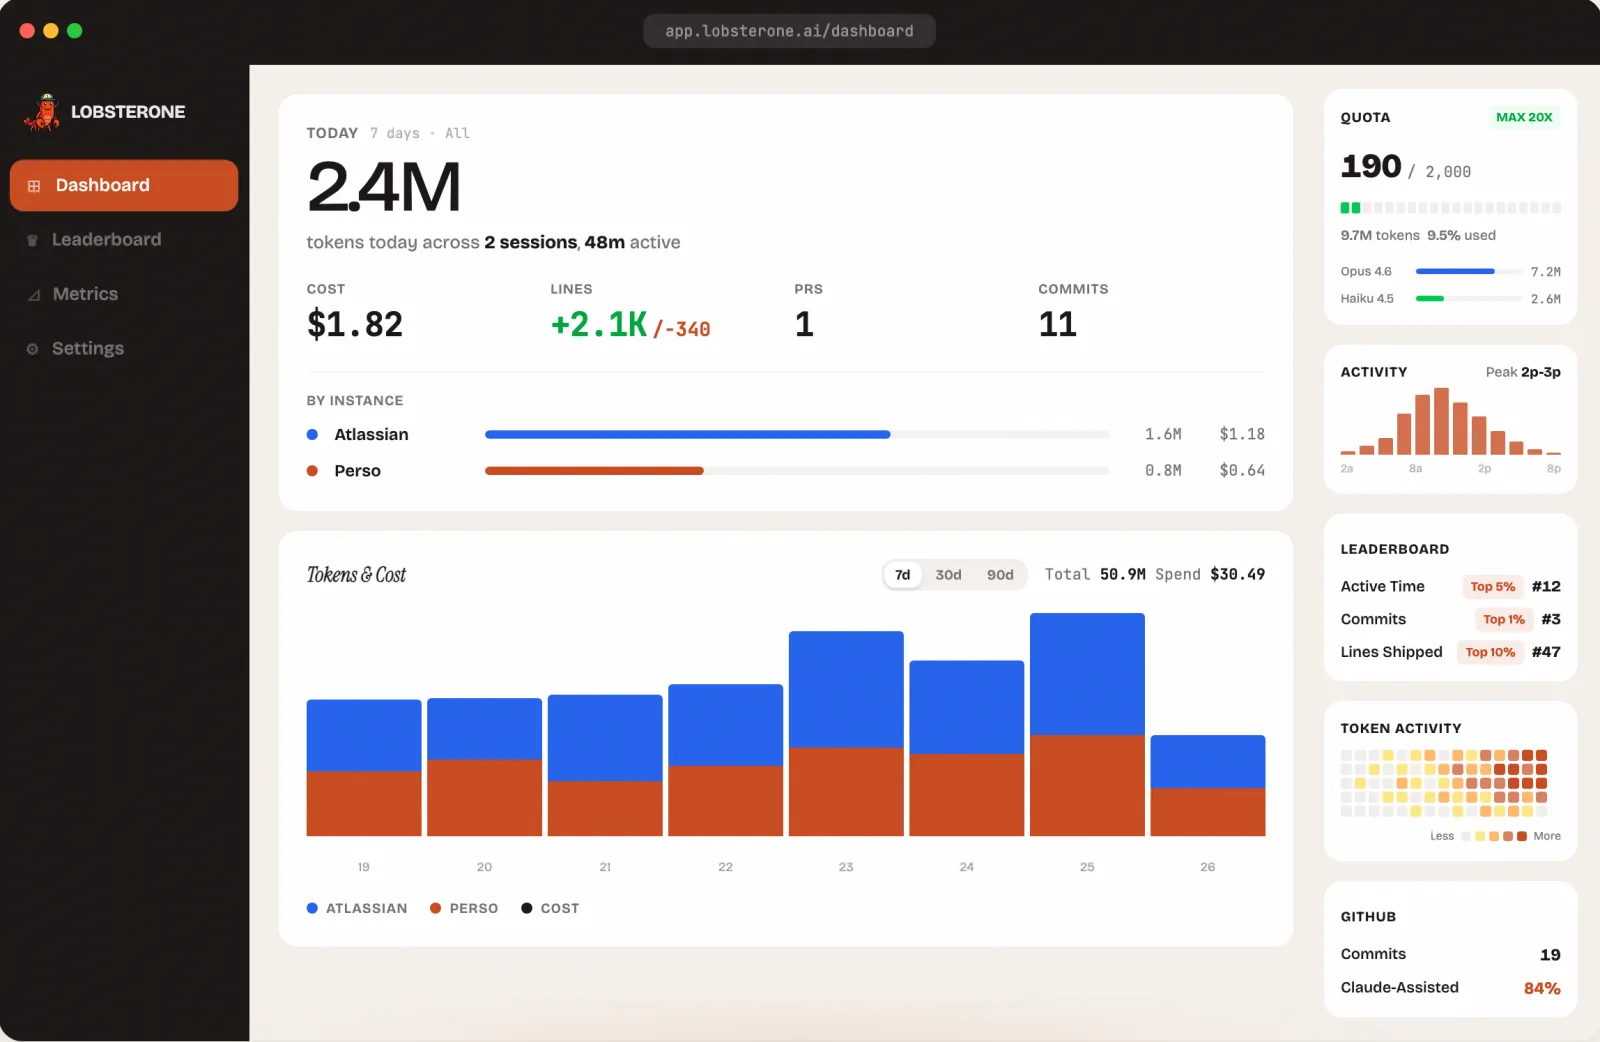
At a glance
| Role | Sole engineer and product owner |
| Period | March 2026 to today, about 1,320 commits across 6 repositories |
| Product | macOS menu bar app plus web dashboard, free for individuals, $4.90 per seat per month for teams |
| Stack | AWS serverless (Lambda, API Gateway, SQS FIFO, DynamoDB, Cognito, EventBridge), RDS PostgreSQL, Swift, Next.js 16, Astro |
| Providers | Claude Code, Codex, Cursor, Mistral Vibe |
| AI | Claude Opus 4.6 usage advisor, Claude Haiku 4.5 game characters |
| Scale | 32 Lambda functions, 5 CDK stacks, 98 SQL migrations, 8 queues, about 70 API routes |
Traction
LobsterOne is an invite-led product with heavy users. Since March 2026 it has tracked 1.93 billion tokens of AI coding work, $166k of API-equivalent spend and 4 million AI-written lines of code for 15 developers across the US, Australia and Germany.
| Metric | Value |
|---|---|
| Registered accounts | 39 |
| Accounts that sent usage data | 15 |
| Active in the last 30 days | 11 |
| Organizations with team dashboards | 2 |
| Tokens tracked (input + output, cache excluded) | 1.93 billion |
| Cached input tokens read | 217 billion |
| API-equivalent cost tracked (Claude Code) | $165,800 |
| Claude Code sessions | 20,525 |
| Lines of code added by AI tools | 3.98 million |
| Commits and pull requests made by AI tools | 13,761 and 1,957 |
| Raw telemetry rows held (90-day window) | about 176 million |
Usage jumped in July 2026, when 17 new accounts signed up and active developers went from 5 to 14. Figures are from the production database on 16 October 2026; one internal admin account is included.
The product
A developer installs the Mac app and signs in with email or GitHub. The app configures Claude Code to send its OpenTelemetry metrics to LobsterOne and scans the local session files that Codex and Mistral Vibe write. From then on the menu bar shows today's tokens and how much of the plan's quota is used, for example 7.6M / 33%, with the real 5-hour and weekly limits read from Anthropic and OpenAI.
The web dashboard turns that stream into usage by day, model and session, cost, lines of code, commits and pull requests, and an estimate of the CO2 behind it. One Today / 7 days / 30 days switch drives every widget. A GitHub connection matches commits to AI-assisted sessions, and an advisor powered by Claude Opus reviews a user's habits and suggests changes.
The social layer is what brings people back: 14 leaderboards (global, organization, country, role, company size, efficiency and more), 113 achievements, XP, public profiles and challenges. Teams get a private leaderboard and team analytics, and anyone can opt out of public boards.
The hard part is the data, not the dashboard. Each tool reports usage its own way, some as running totals and some as increments, and users compare every number with what their terminal says. Getting those numbers right took more engineering than any screen.
Architecture
Six repositories on one AWS account, deployed by CDK from GitHub Actions on every push to main, with migrations run before each deploy. Everything is a Lambda except the database: uploads are accepted fast and queued, and slow work (delta conversion, rollups, snapshots, email) happens behind the queues. One small Postgres instance behind RDS Proxy holds everything, because the load is many tiny writes, not heavy compute.
The ingest pipeline
The upload Lambdas only authorize and enqueue, so a burst of uploads never touches the database directly. The metrics queue is FIFO with one group per device, because converting running totals into increments only works if each device's points arrive in order. Dashboards read the daily rollup for 7 and 30 days; only the Today view reads raw rows, so it can start at each user's local midnight.
One model for every AI tool
Every provider maps its own metric names onto one canonical set (tokens, cost, sessions, lines of code), so dashboards and leaderboards never name a vendor. Adding a tool is a registry entry plus, when it has no telemetry, a scanner in the Mac app.
| Provider | How usage arrives | What it took |
|---|---|---|
| Claude Code | OpenTelemetry metrics and events, sent straight from the CLI | Detecting delta or cumulative temporality per payload; cost and tokens per request from events |
| Codex | Mac app scans ~/.codex session logs and sends deltas | Splitting cached from fresh input; lines of code rebuilt from apply_patch diffs; real rate limits from the logs |
| Cursor | OpenTelemetry, same path as Claude Code | Registry entry only |
| Mistral Vibe | Mac app reads per-session totals in ~/.vibe/sessions | Turning per-session running totals into increments on the device |
What tracking several AI tools taught me:
- Know if a counter is a total or an increment. I traced a 15 to 20% token gap to Claude Code sending increments where ingest expected running totals. Ingest now checks each payload, and a scoped migration rebuilt the affected rollups from raw data, so every historical number is now right.
- Pick one token convention and explain it. Cached input can be 90% of a long session. LobsterOne counts input plus output, like several other trackers, and the menu bar says why its number is lower than the terminal's.
- Never hardcode a vendor's limits. Codex quota reads OpenAI's own 5-hour and weekly percentages straight from the session logs, rather than estimating from another vendor's allowance.
Making it reliable
Users notice a wrong number faster than a slow page, so most work after launch went into correctness and recovery. Each fix below came from production.
| Problem | Fix |
|---|---|
| A flood of Codex tracing spans (85% of rows) filled the 100 GiB database | A provider prefix filter at ingest, gp3 storage with headroom, and written rules for replaying the dead-letter queue without double counting |
| An API key whose cache entry was lost got a 403 on every upload, forever | A reconciler re-syncs the key cache with the database every 5 minutes, and the Mac app re-mints its own key on repeated 401 or 403 |
| GitHub sign-in worked exactly once per user, because the original user pool froze the email attribute | A second Cognito pool with a mutable email, lazy migration that keeps passwords, and an authorizer that accepts both pools |
| Australian users saw an empty "today" every morning when the UTC day rolled over | "Today" is computed live from raw data at each user's local midnight; 7 and 30 days read precomputed snapshots |
| Deadlocks during an ingest burst sent about 830 events to the dead-letter queue | 752 replayed with no errors; every dead-letter queue now alarms on its first message |
| A session restart resets a running total, which naive subtraction reads as negative usage | A lower value is treated as a reset, and metrics are processed in order per device through a FIFO queue |
The pattern: raw data is kept as received for 90 days, rollups can be rebuilt from it, and every queue has a dead-letter queue with an alarm behind it.
Cost, pricing and growth
Running cost. The whole platform runs for $70 to $85 a month on AWS, before tax. In June 2026 I cut the bill from $114 to $73: VPC endpoints pinned to one availability zone and the read replica deleted. I kept the RDS Proxy, because with the replica gone it is what protects the small database from connection spikes when queues burst.
Pricing. Individuals use LobsterOne free. Teams are priced at $4.90 per seat per month for a private leaderboard, team analytics and admin controls.
Acquisition. An Astro marketing site at lobsterone.ai with 68 articles on AI coding costs and habits, invite and referral codes, and shareable LinkedIn cards. Postmark sends the lifecycle emails: an onboarding sequence, a Sunday weekly recap and a nudge when the Mac app is out of date. The Mac app ships itself: every push to main is archived, notarized and delivered through Sparkle auto-update.
Outcomes
Working alone for seven months, I took LobsterOne from a CLI prototype to a multi-provider analytics platform. It has tracked 1.93 billion tokens and $166k of AI spend, for about $80 a month in infrastructure.
- Shipped: a native Mac menu bar app that updates itself, ingest for four AI coding tools, a web dashboard with 14 leaderboards and 113 achievements, team analytics, a Claude-powered usage advisor, an admin backoffice, a marketing site with 68 articles and a prototype pixel-art multiplayer game driven by real coding stats.
- Correct: raw telemetry is kept as received, so a wrong rollup can be rebuilt instead of patched, and every fix is scoped to the one provider it affects.
- Recoverable: every queue has a dead-letter queue with an alarm, the API key cache heals itself every 5 minutes, and the Mac app repairs its own credentials.
My lessons for teams building analytics on AI tools:
- The numbers are the product. Users check them against their terminal, so each convention (cache, temporality, time zone) has to be chosen on purpose and explained.
- Treat every vendor's telemetry as unstable. Tools add, rename and flood metrics between releases; filter at ingest and never let one provider's shape leak into shared queries.
- Size infrastructure to real load. A micro database behind a proxy carries 176 million rows of telemetry; the risks were storage and connection spikes, not CPU.